During 2024, we experienced a lot — recession/growth, inflation/disinflation, higher/lower rates — as market sentiment swings were the only constant theme throughout the year. Despite all the contradictory predictions, we had a positive, if not resilient, economic year with strong GDP growth, continued low unemployment and inflation that finally proved to be transitory.

U.S. Real GDP Growth
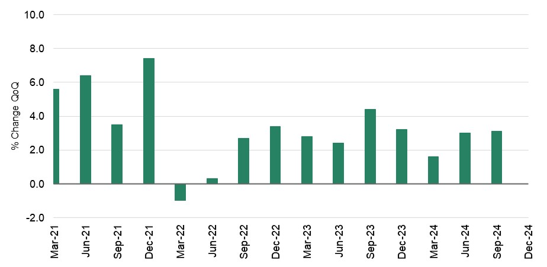
Source: Factset
U.S. Unemployment Rate

Source: Factset
As we began 2024 and throughout the first quarter, the outlook for the year was that a recession was just around the corner and that there would be six rate cuts amidst a backdrop of slower growth. As we ended the first quarter, despite slightly lower GDP, the stock market continued the momentum of 2023 and provided a positive backdrop for stocks. Despite the market continuing to favor a concentrated list of growth/technology stocks, all equities participated in the upswing in the first quarter. The equal-weighted S&P 500® returned 7.9 percent, the S&P 500® returned over 10 percent; the Russell 2000 and EAFE both returned about 5 percent and Emerging Markets returned about 2 percent. Bond performance was negative, as no rate cuts emerged.
As we headed into spring, the expectation for those six rate cuts waned, and stocks and bonds declined during April, before reversing course as the artificial intelligence (AI) craze took hold. The AI craze further concentrated the market returns into the large growth and technology-oriented stocks at the expense of other areas of the stock market. By summer, as expectations took hold that the economy was downshifting and rate cuts were back in play, there was a strong rotation into value and small cap; even non-U.S. stocks outperformed U.S. stocks in July for the first time in 2024. The dog days of summer ended and, as we wrote in our September “Waiting for Godot” article, the Federal Reserve (Fed) finally gave the markets the long-anticipated first rate cut of 2024. This 50-basis point rate cut was larger than expected and spooked the markets. October brought us just the second down month of the year amidst the backdrop of stronger economic data.
November provided a huge election rally. The biggest winners were small cap stocks thanks to the post-election narrative of lower taxes and tariffs providing a tailwind. Soon afterwards, the Fed’s follow-up rate cut in December was accompanied by a forecast of “higher for longer” and fewer rate cuts than the market was anticipating. Small stocks fell, and the U.S. stock market ended December with a rotation back to the mega cap tech names which had driven the market during the year.
From an economic standpoint, 2024 defied expectations with stronger growth than anticipated and, while there was a slowing in employment, overall, the 4.3 percent unemployment rate at year end is still below the long-term average. Inflation progress was steady and slow throughout the year, driven down by continued low energy prices, with stickiness in shelter holding back progress toward the Fed’s preferred level of 2 percent.
Inflation
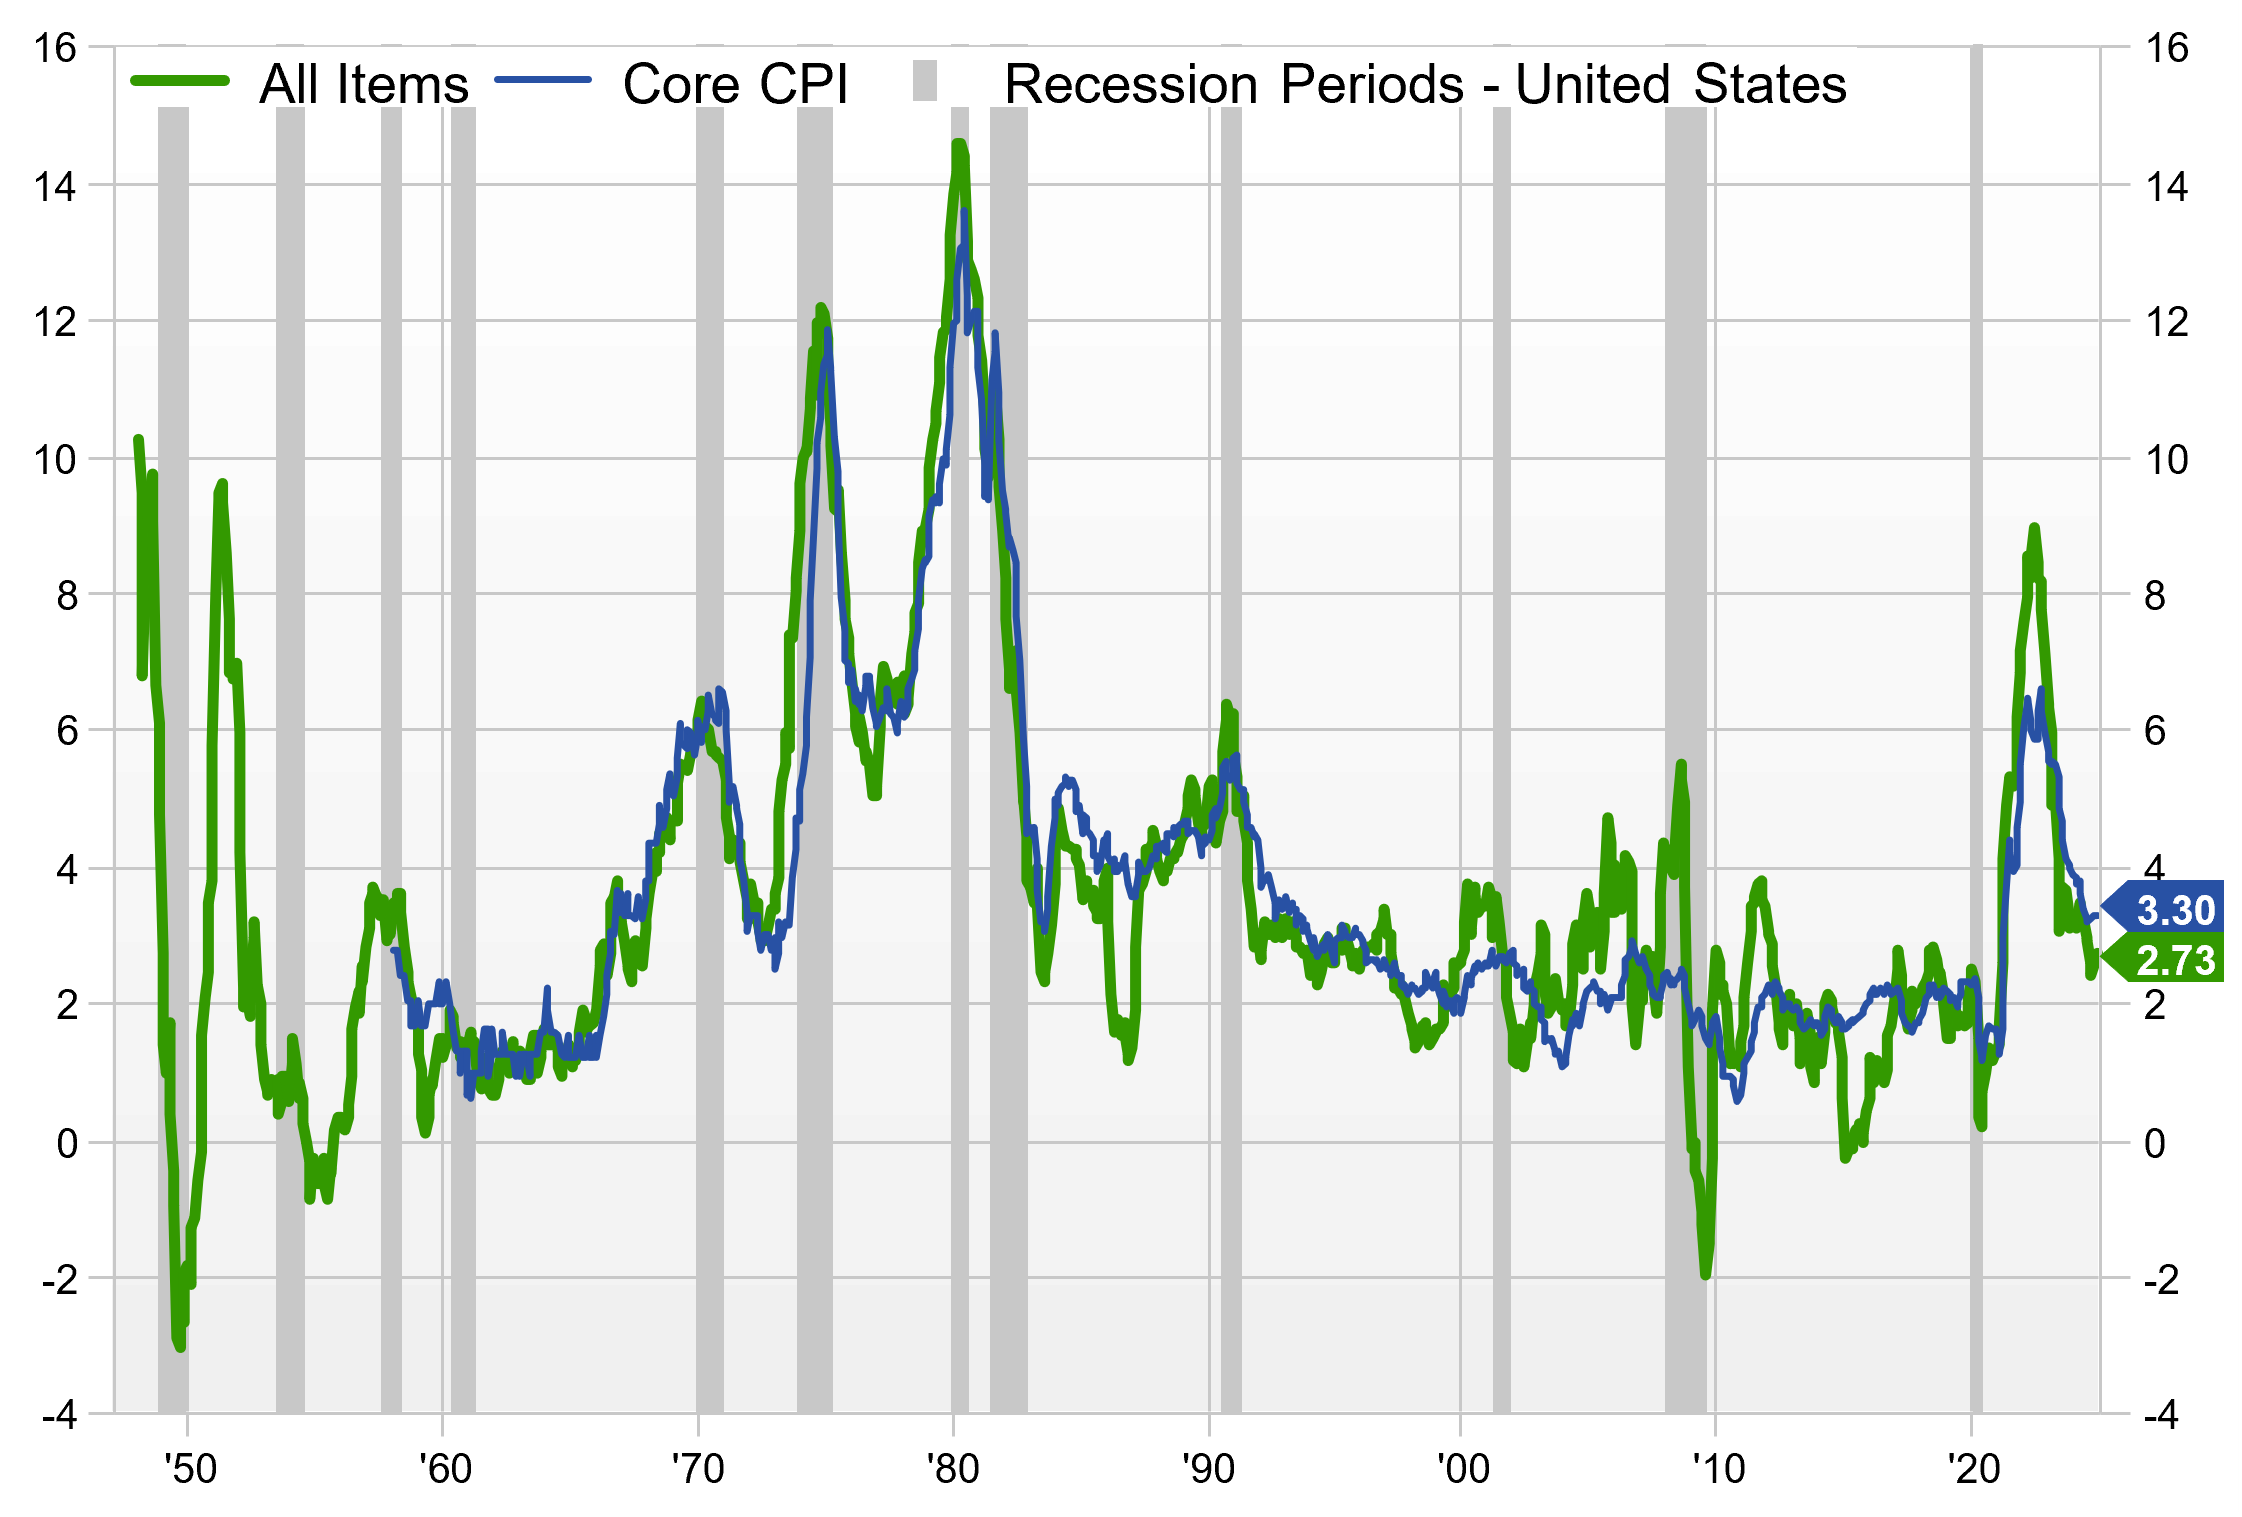
Source: Factset
Equity markets
U.S. markets
Despite the S&P 500® dropping -2.4 percent in December, the full-year return of 25 percent was very strong. Adding in the 2023 return of 26.3 percent, we have seen two back-to-back, double-digit equity markets. Not since the 90s have we seen this sort of consecutive strength.
2024 Stock Market Performance
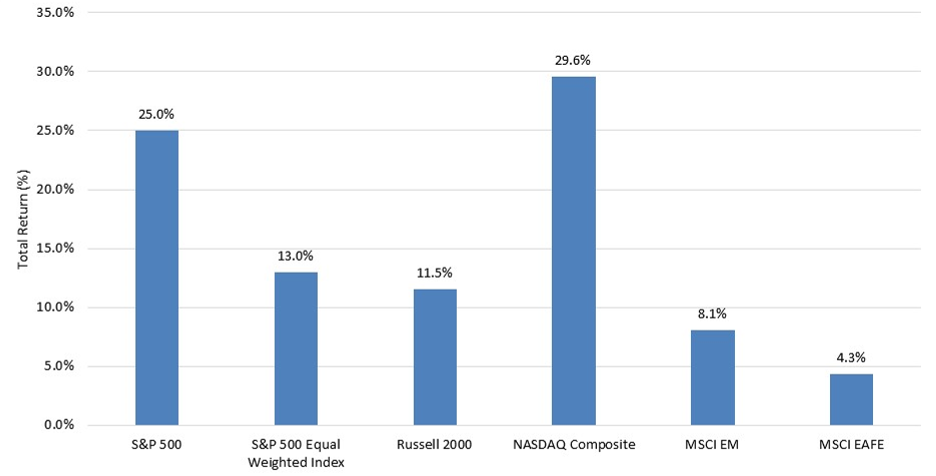
Source: Factset
The S&P indices are a product of S&P Dow Jones Indices, LLC and/or its affiliates (collectively, “S&P Dow Jones”) and has been licensed for use by Segal Marco Advisors. ©️2025 S&P Dow Jones Indices, LLC a division of S&P Global Inc. and/or its affiliates. All rights reserved. Please see www.spdji.com for additional information about trademarks and limitations of liability.
Overall, the market has been driven by a small cadre of tech and growth-related stocks, as demonstrated by the S&P equal-weighted index returning only 13.9 percent in 2024. Interestingly, the equal-weighted return of the S&P 500® of 13.9 percent compares to the equal-weighted return in 2023 of 13 percent. So, in consecutive years, we saw the domination of growth- and tech-related companies drive the return for the index. Adding to the concentration of return, small capitalization stocks also lagged during the year, despite the strong post-election rally in November. The full year Russell 2000 return of 11.5 percent was less than half the return of large cap stocks.
We ended 2024 with another strong year of profits for corporate America, at 9 percent for the S&P 500® and the valuation on the S&P 500® is currently 21.5x on a forward P/E basis. A sizable percentage of both earnings and valuation is being driven by technology stocks, which now comprise 32 percent of the index, with the top 10 stocks in the S&P 500® accounting for 29.8x valuation and the other 490 stocks at 18.2x, bringing those top 10 to an all-time high percentage in the index. Consensus expectations are for earnings in 2025 to exceed 14 percent. This expectation seems high but would be necessary to maintain the valuations where they stand today for those large cap stocks. However, other areas in the market are not as pricey, such as small cap stocks post the year-end drop. Margins have also been strong at over 8 percent year to date through September, rebounding from the inflation backdrop that impacted costs in 2022 and 2023.
In terms of economic sectors, with the exception of a flat return for the Materials sector, all sectors of the S&P 500 Index® were positive in 2024, with Communication Services returning 40.2 percent (Amazon) and Information Services returning 36.6 percent. Not so for small cap stocks, where sector performance was more varied, and Energy was down for the year.
2024 Economic Sector Performance
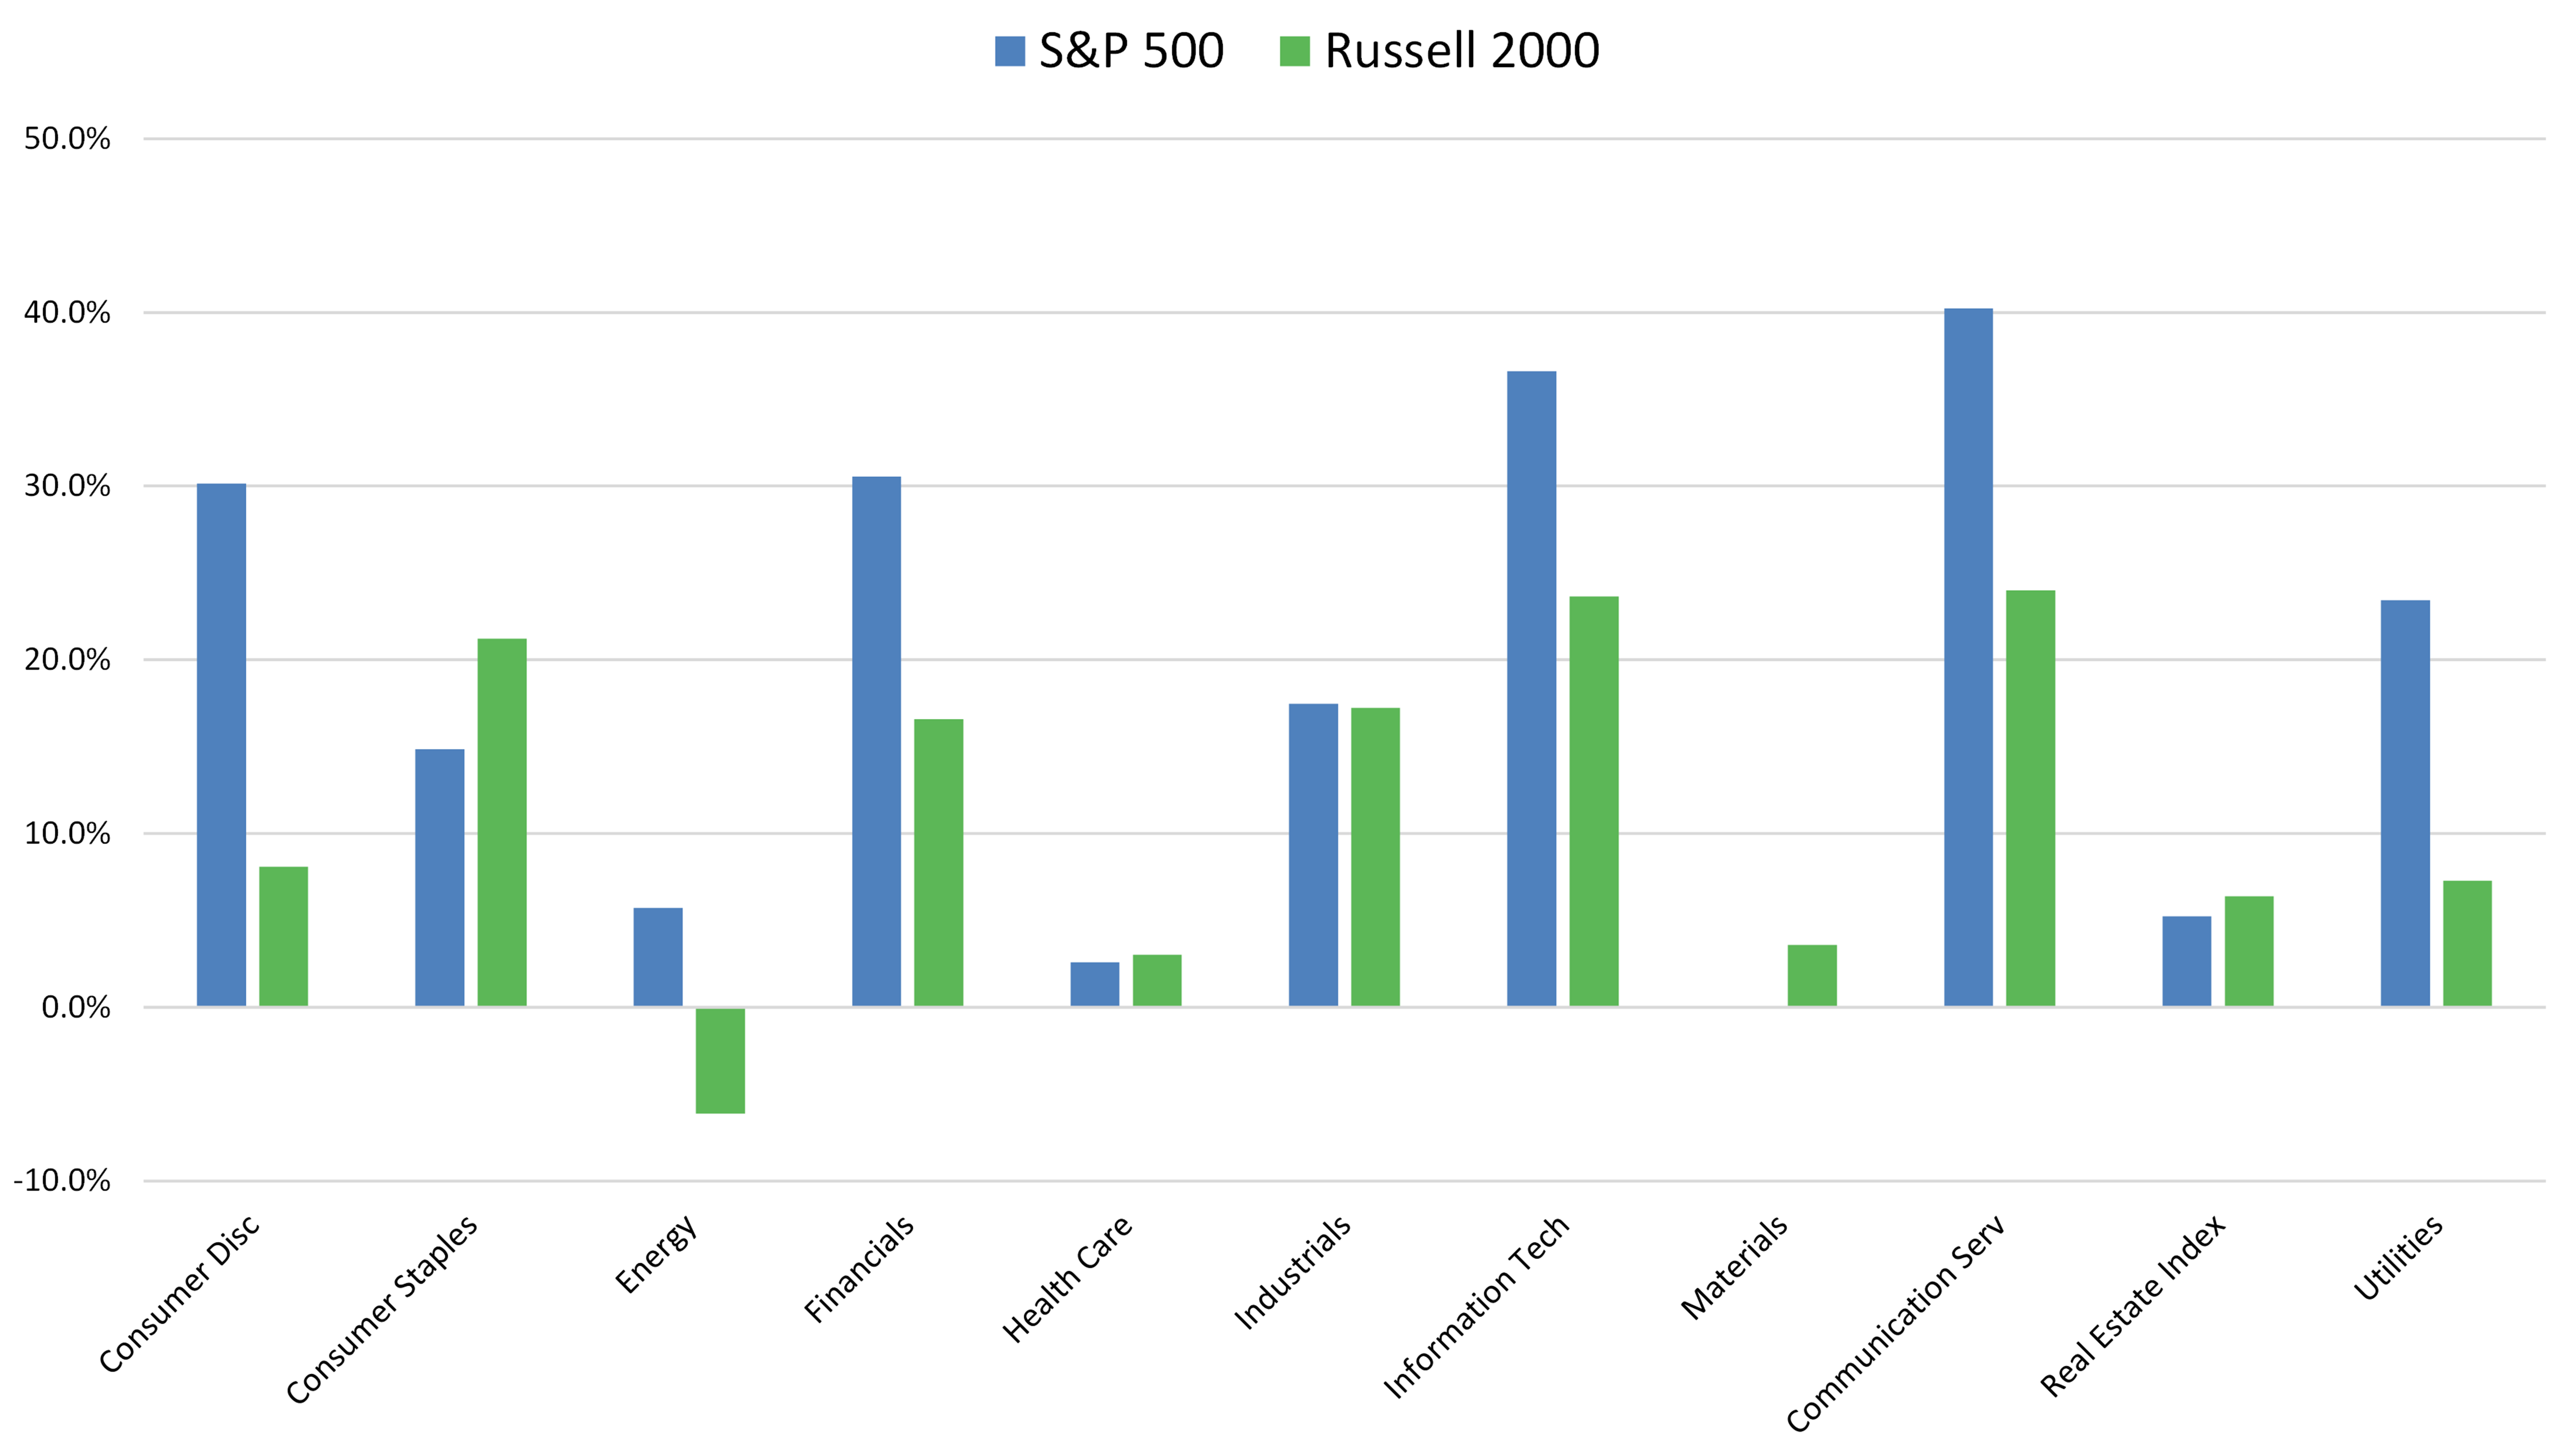
Source: Factset
Non-U.S. developed markets
The narrative of U.S. exceptionalism and a strong dollar impeded non-U.S. stock returns versus U.S. returns. While the year ended up being positive, lower growth and higher inflation projections for developed markets continues to weigh on stocks. The range of returns throughout the developed markets was broad in 2024. France delivered the weakest annual performance since the eurozone crisis due to concerns over tariffs, luxury good demand dropping, and fiscal and political headwinds.
2024 Non-U.S. Developed Market Performance
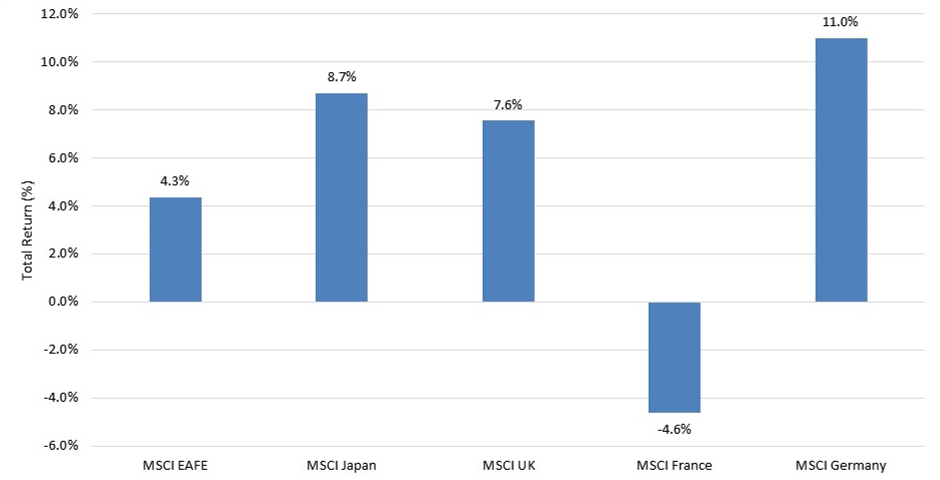
Source: Factset
Valuations are the one area that provides a glimmer of hope for non-U.S. investments relative to U.S. stocks, with the forward P/E on the ACWI x U.S. of 13.3x versus the U.S. at 21.5x. This is over a two standard deviation forward P/E discount to the U.S.
The question remains if it is enough of a bargain versus the potential for slower growth and a strong dollar. The new administration in the U.S. is hard to read, seemingly speaking to both a desire for a weaker dollar to help U.S. manufacturing, and higher tariffs to bolster U.S. goods prices relative to other countries. It is difficult to know exactly where this push-pull will end up for the dollar, and in fact is hard to gauge since it looks like it might come down to a country-by-country basis. If that is the case, active management versus indexing may prove to be the key to navigating the shifting landscape of developed markets.
Emerging markets
Speaking of country by country, emerging markets continue to be an area where active selection continues to be a key tenet of return.
2024 Emerging Market Performance
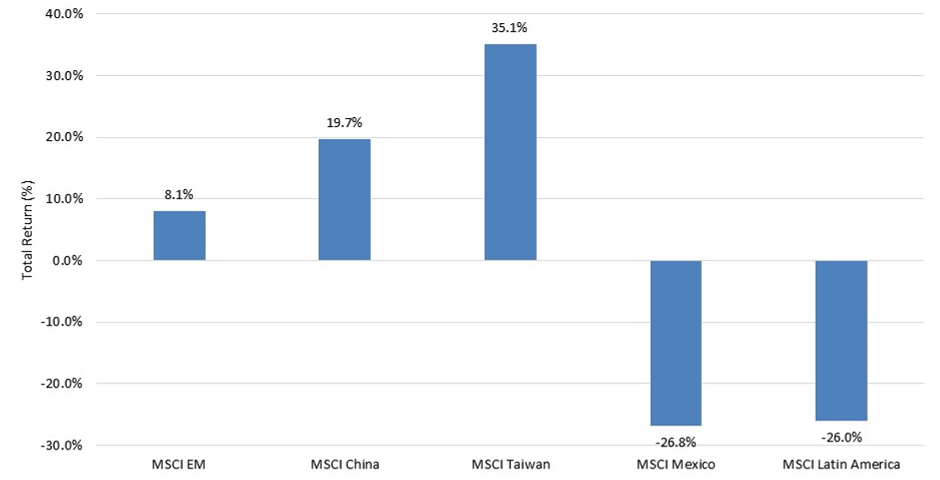
Source: Factset
Countries like Taiwan and Korea had a good run in 2024 amidst the backdrop of the AI trade, until political ramifications cut into the outlook in Korea. Taiwan’s return of 35 percent was the winner in 2024. The largest and most important emerging country, China, had a negative backdrop throughout most of 2024, until the government’s stimulus package was announced in September. After the rejoicing stopped, the market fell as investors awaited proof of what the actual stimulus would mean for consumption, debt and consumer demand. Late in the year, when detailed proposals began to be promulgated, it appeared the government was serious about rebooting the economy through increasing housing demand (subsidies and lowering rates), aid to the elderly and students to create demand, reinforcing capital ratios and bank solvency and stimulating the stock and credit markets. The Chinese market ended the year with a return of 19.7 percent, the first positive return for the market since 2020.
Fixed income markets
As the chart below illustrates, 2024 delivered a flattening of the yield curve. However, volatility was high throughout the year, with over 100 basis points of change in the long end alone. The Bloomberg Aggregate Index was only positive seven months during the year, primarily due to a current yield on the 10-year of 3.88 percent at the beginning of the year and 4.43 percent at the end of the year. The rise in rates for the 10-year Treasury highlighted a battle between the Fed that was cutting rates and the fixed income markets that continued to worry about inflation and the economy and countered the Fed’s efforts.
United States Treasury Yield Curve
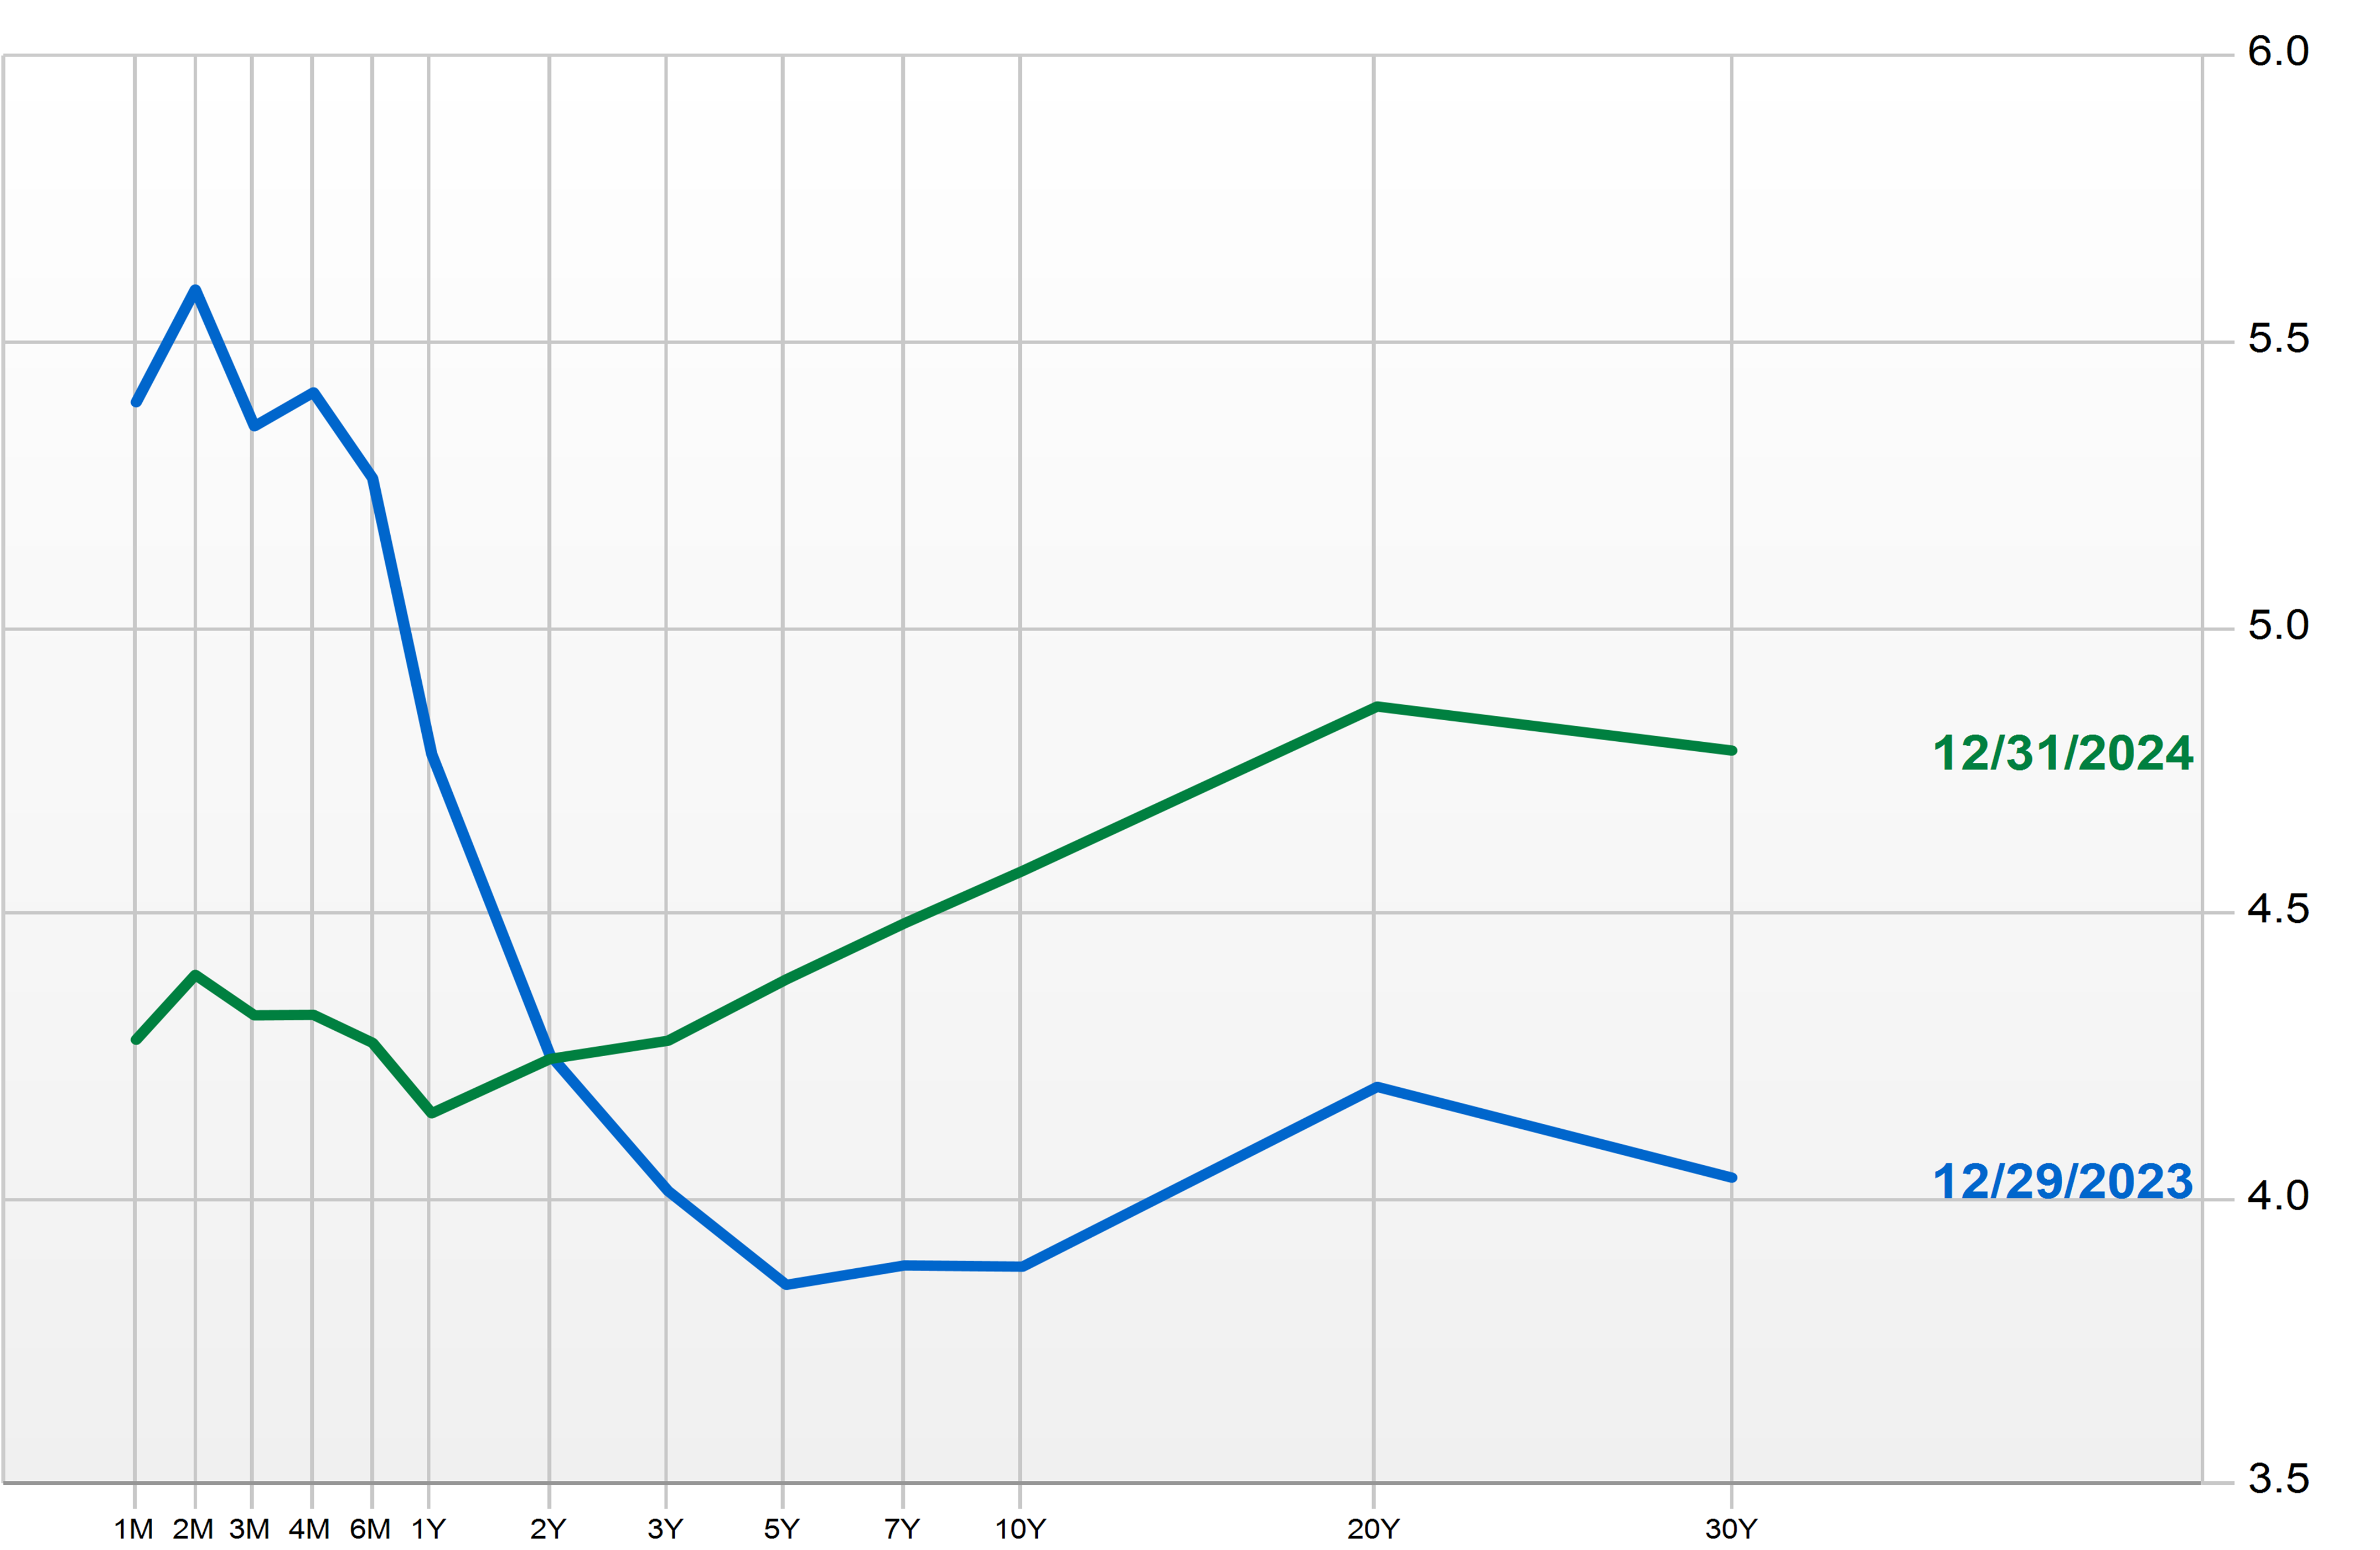
Source: Factset
The investment-grade credit backdrop remains very tight, with year-end spreads at 80 basis points versus a 149 basis points historical average. High yield is also tight at a current spread of 287 basis points versus 513 basis points historical average. Credit yields, however, continue to provide good income with an investment grade yield to worst at an average of 5.3 percent at year-end (versus an historical average yield of 4.4 percent) and for high yield 7.5 percent versus 8.1 percent.
Despite these positive income levels, the total return on bonds in 2024 were disappointing. The Bloomberg Aggregate Index return of 1.3 percent was driven down by the volatility of returns as expectations shifted on the Fed’s stance on rate cuts. On average, a bond’s return is over 90 percent correlated to income, but over the last two years, the price has overwhelmed the positive real yield of the instruments. This is an unusual circumstance, but not unprecedented. Maintaining a shorter duration was a positive during the year, with 1–3-year bonds (credit) returning 5 percent and Treasuries 4 percent.
Supply remained strong throughout the year for both credit restructuring and Treasuries given the amount of government debt that needs to be financed. Defaults also remained low, despite an uptick in 2024.
Private markets
With the lag in valuation across private assets, we will update and provide a detailed review further into 2024. But a couple of observations follow.
While Real Estate returns continued to be challenged in 2024, due to decreasing valuations, by late in the year we saw what many perceive to be a bottom in the price declines. Sector-by-sector performance varied widely with some winners, such as data centers on the back of AI trade and continued losses in office, although here, too, location and prices varied widely.
Private Credit continued to provide positive yield and, despite some uptick in defaults, restructuring of problem assets was available to many lenders thanks to a large supply of capital.
Finally, Private Equity continued to be characterized by an environment of low exits due to the complicated mergers and acquisitions market backdrop. While we did see some M&A activity in 2024, it did not support the backlog that is estimated by Bain & Co. to be on the order of $3 trillion of ageing deals waiting for exits. As a result, distributions continue to be very low, and the use of continuation funds to provide liquidity remained popular, with Jeffries estimating that they were $58 billion of deals or about 14 percent of all exit deals during 2024. Within Private Equity, here too, however, there was varied performance results by sectors, which will likely impact the final results when we have them later in 2025.
Outlook 2025
Taking a step back, many investors today have only known bear markets resulting from crisis situations, such as the dot-com bubble, the GFC and the COVID-19 pandemic. A business recession is not well “experienced” by the average investor. Perhaps this fact, coupled with the history of yield curve inversions resulting in recession, was why the prediction for 2024 was universally a recession.
Of late, we see a lot written about where the excesses lie that will cause a downturn. Much of the focus is on the credit backdrop related to the increasing cost of debt, as well as the use of amend and extend and its impact on the business landscape, especially if we stay in a “higher-for-longer” rate environment. It is possible we could see some rollover issues cause selective debt troubles, or real estate debt related to office or the growth of private credit. In addition, personal debt is higher and an important criterion for continued growth as consumers are responsible for the majority of growth-related to GDP. So, the health of the consumer is paramount.
There are counterpoints to consider; people have jobs and we have had the first positive real wage growth in decades, the wealth effect has exceeded a trillion dollars given the market performance of the last two years, and house prices are also adding to wealth. The positive effect of low-fixed-rate mortgages keeping people from selling their homes continues to stall a rise in housing inventories. And, if we stay in a higher-rate environment for longer, it is hard to see a change in this backdrop.
Inflation is one boogieman we can point to as a possible storm cloud and is dependent on the new administration’s policies related to tariffs, fiscal policy, government debt and supply chains, but hazarding a guess on this at this point is beyond our capabilities.
Having said all that, the markets (certainly parts of it, at a minimum) are pricey. Given spread levels in fixed income credit, bargains here are also not plentiful. But the outlook for corporate America remains strong and taxes will undoubtedly remain at today’s level and maybe lower, which could provide a tailwind to valuations.
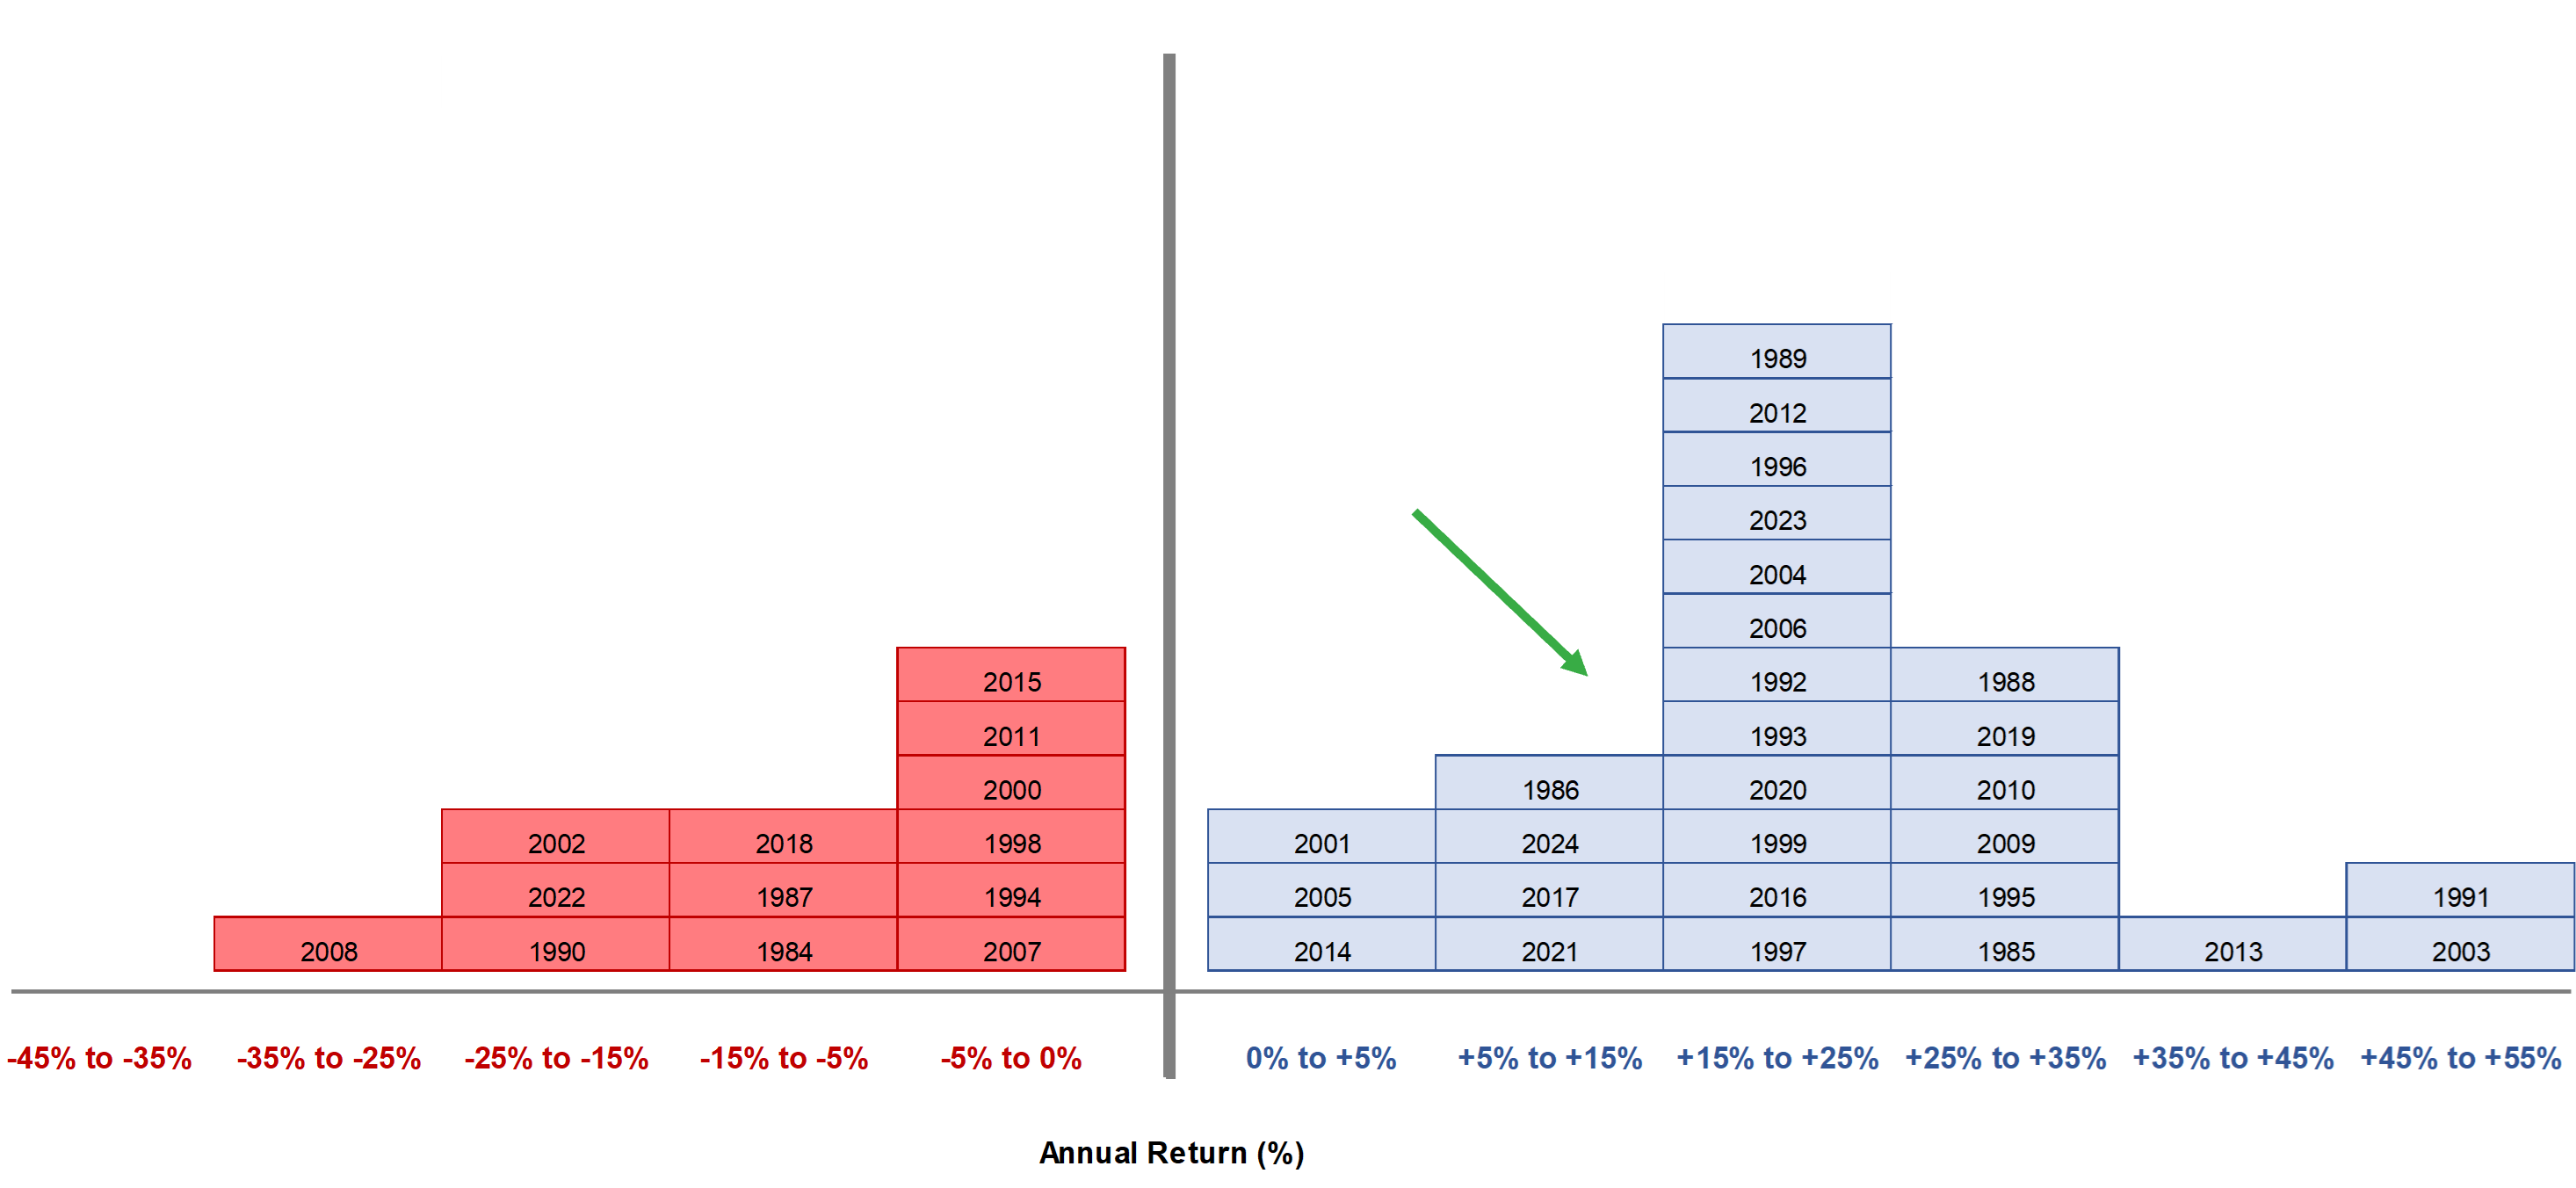
Looking at the histograms below, with 2023 and 2024 providing over 70 percent return on the S&P 500® from trough to peak, we have come a long way for many large capitalization stocks. Small capitalization valuation looks better.
S&P 500® Histogram 1984–2024
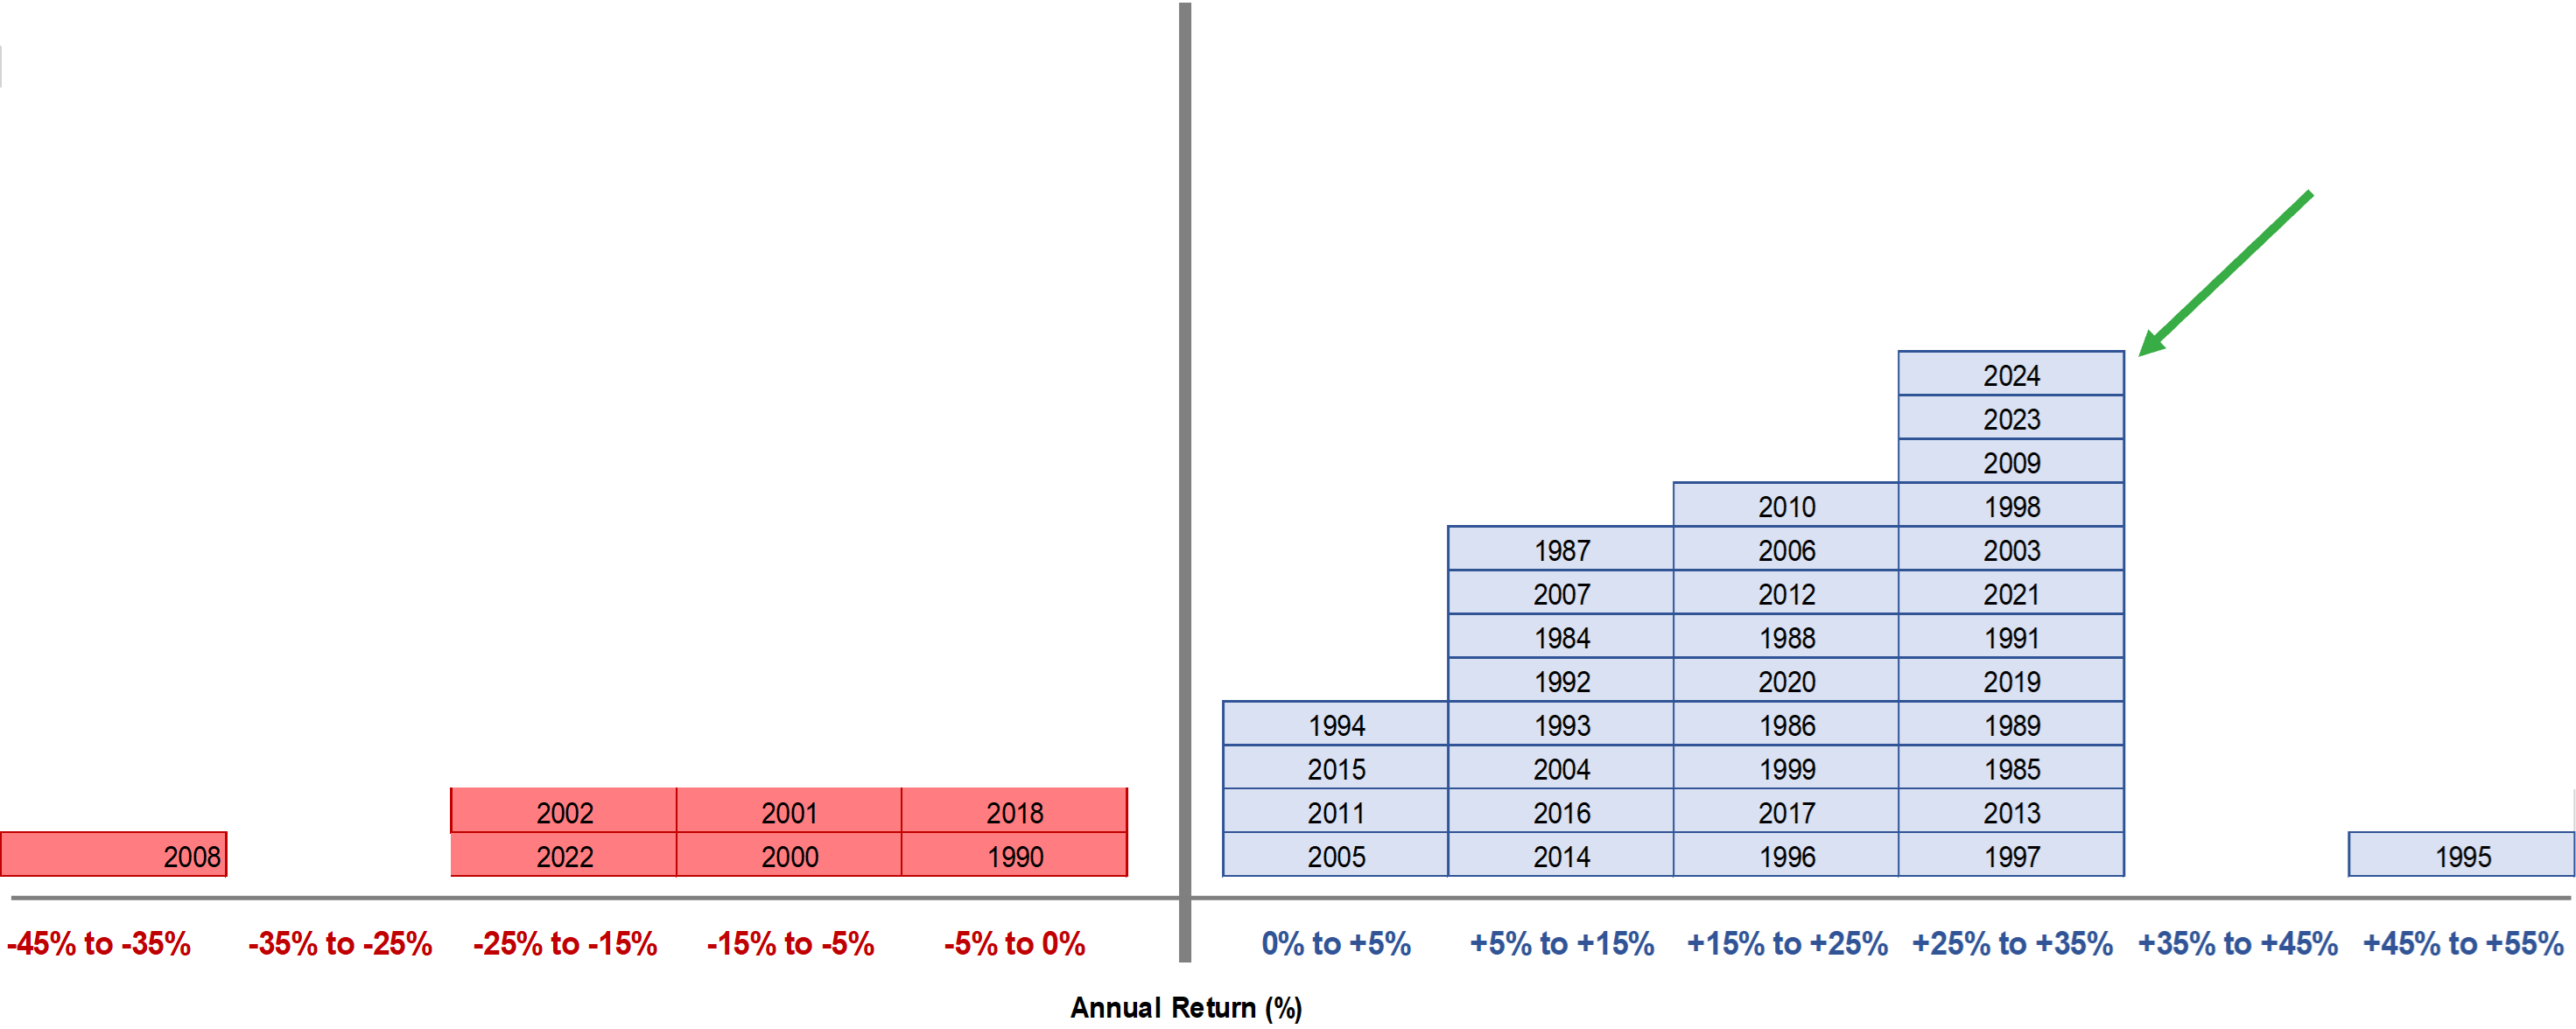
Source: Factset
Russell 2000 Histogram 1984–2024
Source: Factset
Borrowing from one of Howard Marks’s memos at Oaktree Capital, these three oxymorons, “jumbo shrimp”, “commonsense” and “macro expert”, aptly describe the ability of anyone to forecast the markets. Thus, we provide some thoughts and some facts for your digestion.
If you thought 2024 was an interesting year, 2025 is stacking up to be more so.
See more insights

Model Pension Plan’s Funded Status Increases by 5 Points

December 2024 Financial Markets Recap: No Santa Claus Rally This Year

November 2024 Financial Markets Recap
The information and opinions herein provided by third parties have been obtained from sources believed to be reliable, but accuracy and completeness cannot be guaranteed. This article and the data and analysis herein is intended for general education only and not as investment advice. It is not intended for use as a basis for investment decisions, nor should it be construed as advice designed to meet the needs of any particular investor. On all matters involving legal interpretations and regulatory issues, investors should consult legal counsel.
