One month into 2025! The month began on a positive note for stocks and bonds, despite a volatile macro environment. The Federal Reserve kept interest rates on hold, while the first print of 4th quarter GDP was 2.3 percent, with consumer spending contributing 2.8 percent to the overall growth rate, thus demonstrating the relative weakness of some other areas of the economy. The negative contributions to growth came from business equipment investment and inventories. The 4th quarter growth figure was slightly slower than the average of the previous three quarters (2.5 percent) and below the 3rd quarter (currently 3.0 percent).

January 2025 Investment Performance
| Equities | (%) |
|---|---|
| All Cap U.S. Stocks |
|
| Russell 3000 | 3.2 |
| Growth | 2 |
| Value | 4.5 |
| Large Cap U.S. Stocks |
|
| S&P 500® | 2.8 |
|
Russell 1000 |
3.2 |
| Growth | 2 |
| Value | 4.6 |
|
Mid Cap U.S. Stocks |
|
|
S&P 400 |
83. |
|
Russell Midcap |
4.3 |
| Growth | 6.4 |
| Value | 3.5 |
| Small Cap U.S. Stocks |
|
| S&P 600 | 2.9 |
| Russell 2000 | 2.6 |
| Growth | 3.2 |
| Value | 2.1 |
| International |
|
| MSCI EAFE NR (USD) | 5.3 |
| MSCI EAFE NR (LOC) | 4.8 |
| MSCI EM NR (USD) | 1.8 |
| MSCI EM NR (LOC) | 1.6 |
| Fixed Income | (%) |
|---|---|
| Bloomberg |
|
| U.S. Aggregate | 0.5 |
| U.S. Treasury: 1-3 Year | 0.4 |
| U.S. Treasury | 0.5 |
| U.S. Treasury Long | 0.4 |
| U.S. TIPS | 1.3 |
| U.S. Credit: 1-3 Year | 0.5 |
| U.S. Intermediate Credit | 0.6 |
| U.S. Credit | 0.6 |
| U.S. Intermediate G/C | 0.6 |
| U.S. Govt/Credit | 0.5 |
| U.S. Govt/Credit Long | 0.4 |
| U.S. MBS | 0.5 |
| U.S. Corp High Yield | 1.4 |
| Global Aggregate (USD) | 0.6 |
| Emerging Markets (USD) | 1.1 |
| Morningstar/LSTA |
|
| Leveraged Loan | 0.7 |
| Alternatives | (%) |
|---|---|
| Bloomberg Commodity | 4 |
| S&P GSCI | 3.3 |
Sources: Standard & Poor's, Bloomberg, MSCI and Russell
The S&P indices are a product of S&P Dow Jones Indices, LLC and/or its affiliates (collectively, “S&P Dow Jones”) and has been licensed for use by Segal Marco Advisors. ©2025 S&P Dow Jones Indices, LLC a division of S&P Global Inc. and/or its affiliates. All rights reserved. Please see www.spdji.com for additional information about trademarks and limitations of liability.
Equity markets
While stock markets began the year on a positive note, volatility increased throughout the month as President Trump’s executive orders related to tariffs, immigration and spending increased the uncertainty regarding corporate earnings, inflation and employment. Large cap growth stocks were also negatively impacted late in the month as the outlook for AI-related investment and U.S. dominance in the space was challenged by China’s DeepSeek news. This was despite good earnings reports from the Information Technology sector. Value stocks outperformed growth for the month as positive earnings from financial stocks helped to boost sentiment. Small cap stocks (Russell 2000: +2.6 percent) were about in line with large cap stocks (S&P 500©: +2.8 percent). Non-U.S. stocks outperformed U.S. stocks in the month (MSCI EAFE: +5.3 percent) and emerging markets were lower, but still positive (MSCI EM: + 1.8 percent).
Fixed income
The Federal Reserve held rates steady during the month at 4.25 percent to 4.50 percent, citing the risks to employment and inflation are “roughly in balance.” As has become the norm, they referenced being data dependent with regard to any upcoming changes to the level of interest rates.
After rising early in the month, interest rates ended at about the same levels as the start of the year. However, the two-year breakeven rate showed markets are anticipating a higher level of inflation ahead, as breakeven rates rose throughout the month to about 3 percent, up from 1.5 percent at year end.
Looking ahead
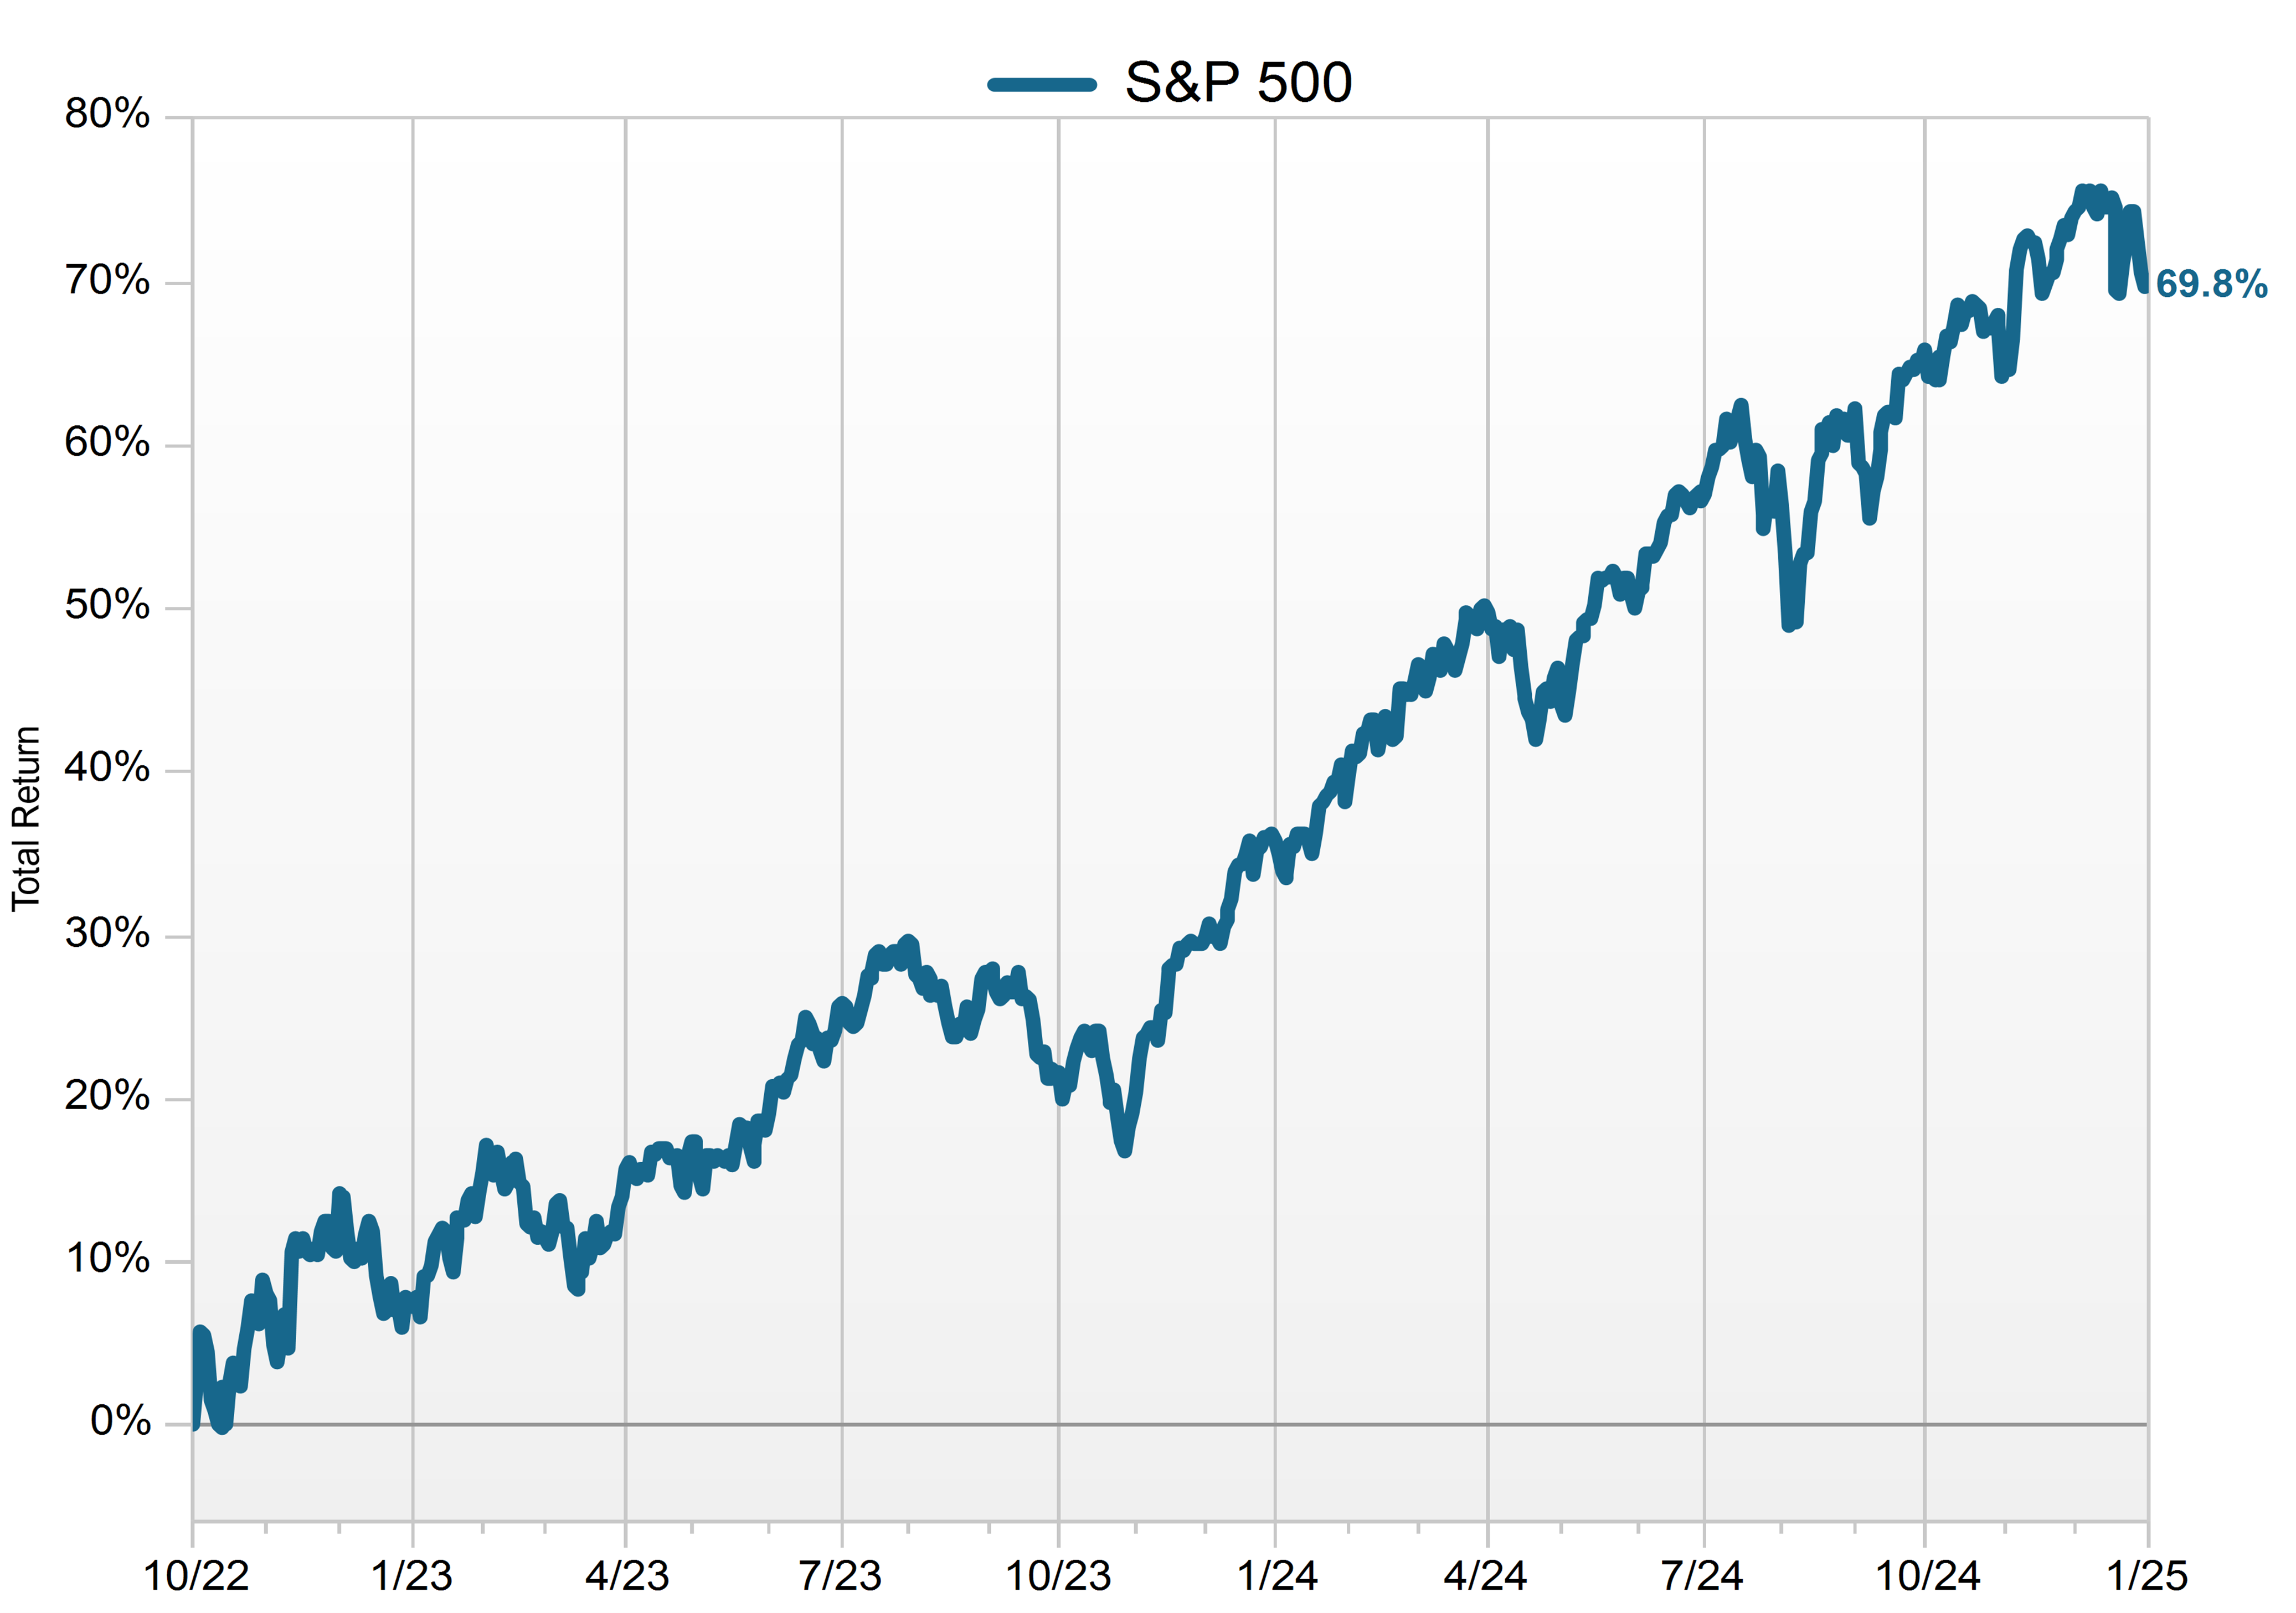
It has already felt like a busy year, with no anticipated slowdown in the coming weeks of news, orders and pronouncements from the new administration. The implications are too varied to outline, and it is too early to have certainty about the potential impact for markets. We continue to advise that short-term volatility should not impact the long-term asset allocation that has been established, especially given the long-term nature of most plans’ obligations. Rebalancing, however, continues to warrant consideration given the two+ great years in the stock market (see chart below) that have driven equity returns.
S&P 500 Performance

Source: FactSet
The S&P indices are a product of S&P Dow Jones Indices, LLC and/or its affiliates (collectively, “S&P Dow Jones”) and has been licensed for use by Segal Marco Advisors. ©2025 S&P Dow Jones Indices, LLC a division of S&P Global Inc. and/or its affiliates. All rights reserved. Please see www.spdji.com for additional information about trademarks and limitations of liability.
We look forward to working with you in 2025!
See more insights

Review of Markets 2024

Model Pension Plan’s Funded Status Increases by 5 Points

December 2024 Financial Markets Recap: No Santa Claus Rally This Year
The information and opinions herein provided by third parties have been obtained from sources believed to be reliable, but accuracy and completeness cannot be guaranteed. This article and the data and analysis herein is intended for general education only and not as investment advice. It is not intended for use as a basis for investment decisions, nor should it be construed as advice designed to meet the needs of any particular investor. On all matters involving legal interpretations and regulatory issues, investors should consult legal counsel.
